Facts, Stories, Conveyance: Postmortem “Data Viz Advice” from a famous American street photographer
 I just got back from spending the last week in the beautiful San Francisco Bay area. If you've never been, seriously, go there. As an obnoxious East Coast / New England guy, I thought I had seen it all. Nope.
Anyways, one of the things we did was visit the SF Museum of Modern Art - the building is a wonder in itself, but obviously the museum hosts countless photographs and art installations from many famous (and not so famous) artists. Honestly, I had no expectations. I was on vacation after all - just doing a fun "touristy" activity between rounds of Grey Goose Oysters shooters, eating sea creatures and pints of AnchorSteam.
I had no idea I'd find inspiration that can be DIRECTLY applied to modern data visualization practices. Advice that doesn't get followed as much as it should...
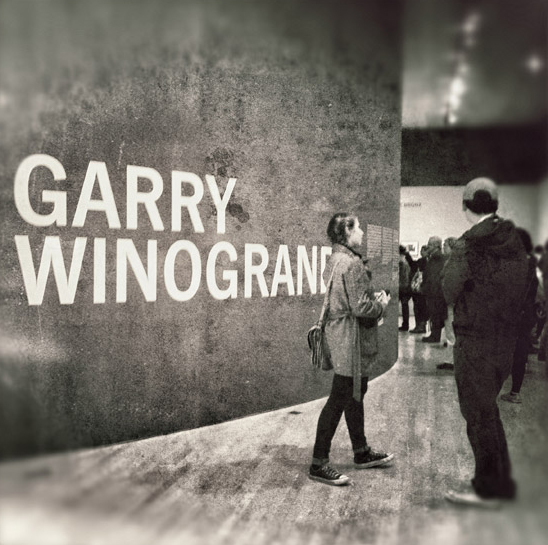
The exhibit - a complete retrospective of the working life and career of Garry Winogrand (1920s - 1984), including many photos that were never published (he left behind 6.5k rolls of undeveloped film when he passed at the age of 56).
Garry was a famous street-documentary photographer mostly known for his NYC shots in the 50s-early 80s. His many striking photos told a story through the faces and bodies of it's living subjects. Short on hard "data" - but miles long on human interest, wonder, and conveyance. Stories of frozen emotions and reactions, but without a full sense of context (aka interpretative art; mystery).
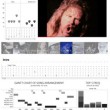
I came upon a particular photo in the "Down in the Bronx" section of the exhibit that caught my eye. It was an assault scene from the 50s. Murder possibly. There was a well dressed man on the ground, you can see only his well-made shoes and an upturned hat on the ground - near a large pool of blood. You can see people rushing around him, a nun leaning in and praying, and a little boy stading in the background looking on with eyes agape. Clearly "something" had happened just moments earlier.
On the display card that accompanied the photo is where I found my connection. It described how Garry always gravitated toward this type of photo journalism instead of blatantly trying to capture the What or Why for the sake of written narration. This quote from him was below it.
"There is nothing more mysterious
as a fact clearly described"
- Garry Winogrand
 Boom. I immediately tapped this quote out on my phone.
It seems that in all the academic and ideological viz wars we've seen lately - people sometimes forget the importance of storytelling and conveyance. Showing the results without the story is next to useless.
Our industry is about action and communication, not mystery.
The facts mean nothing if the reader can't understand it, conceptualize it, or (even worse) be intrigued enough to even give a shit about it.
The reader might be a literal "reader" of a magazine, newspaper, or online periodical - but really in our case the "reader" is YOUR FUCKING BOSS and YOUR CUSTOMERS. It's essential that they not only know the facts, but the breadcrumbs that led to such facts. Seeing is understanding. You can't make things actionable if they can't be understood (even more important is self-explanatory interactive visualizations).
In any useful data viz - calculations & insightful analysis is good, facts are good, in-depth data is good, but...
CONTEXT IS GOD.
It's not only about WHAT you are showing, but about the why, how, and the elusive 'what do we do next'. Data is good, geeky math is good, but if it can't be framed in a way that biz or end-user peeps (or the public) can understand it's just shred fodder that you can use in little Suzi's hamster cage.
Getting and interpreting the data is one part - CONVEYING it is another altogether.
(again - not to get into a Pure Math / Science vs Functional "Art" war - but it bodes discussion)
What do you guys think?