Going Yard: Using MLB data and Tableau 8 to “re-imagine” Homeruns in PetCo Park – “The Business Case”
 Greetings, it's been awhile since I published anything - my apologies! I've been hella busy this year, but finally have dedicated some time to a mini-project I've been working on for some time. This time, it's a baseball viz / park issue that I can hopefully shed some (theoretical) light on. IN an effort to stop writing massive blog posts - consider this post a intro - more like the "Business Case", the next one will be "Technical HOW, WHY, WHAT".
Anyways, on with the premise...
THE QUESTION:
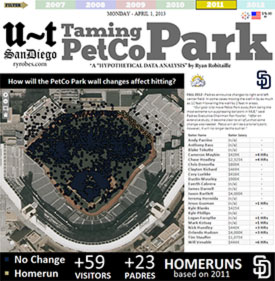
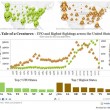
The San Diego Padres are changing the wall dimensions for their home stadium, PetCo Park, for the 2013 MLB season. In a notoriously large "pitchers park", how might this change affect the amount of Homeruns, the Padres record, and (possibly) ticket sales?
MY APPROACH:
Using freely available data from the MLB Gameday app (via their awesome XML datastore) can we map out the hitcharts for the past 3-5 years (by mapping Gameday x,y coordinates to geocoded coordinates) and see what effect a closer (and lower) wall would have had on THOSE seasons. Changing Outs and Base Hits into HRs (with associated RBIs, if men are on base) If we can try to understand with MIGHT have happened, we can shed some light on what this season might bring.
Tools Used:
- Python = Data Harvesting (MLB, Weather, Salaries)
- SQL = Data Storage (SQL Server 2012 Azure cloud DB)
- Tableau = Data Presentation / Visualization / Analysis
- Photoshop = Designing Layout (mock-up wireframes) + 'Design' Sections of the Viz
- Total Time Taken = Lots. :)
THE RESULTS:
More Homeruns? Yes, as many as 50-100 MORE per year.
More Padres Wins? No (the visiting team will probably gain MORE HRs).
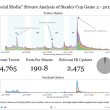
More Ticket Sales? Possibly (HRs make for a more 'exciting' game to watch, and may be a bigger draw for fans than wins - but the jury is out on that).
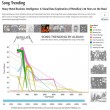
Also, notice that attendance seems to be declining regardless of wins AND plummeting average ticket prices...
Take this with a grain of salt, Baseball is a game that can change on a dime. I'm only making estimations based on that data available.
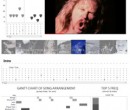
But don't take my word for it - check out the viz in all it's glory by clicking on the image below.
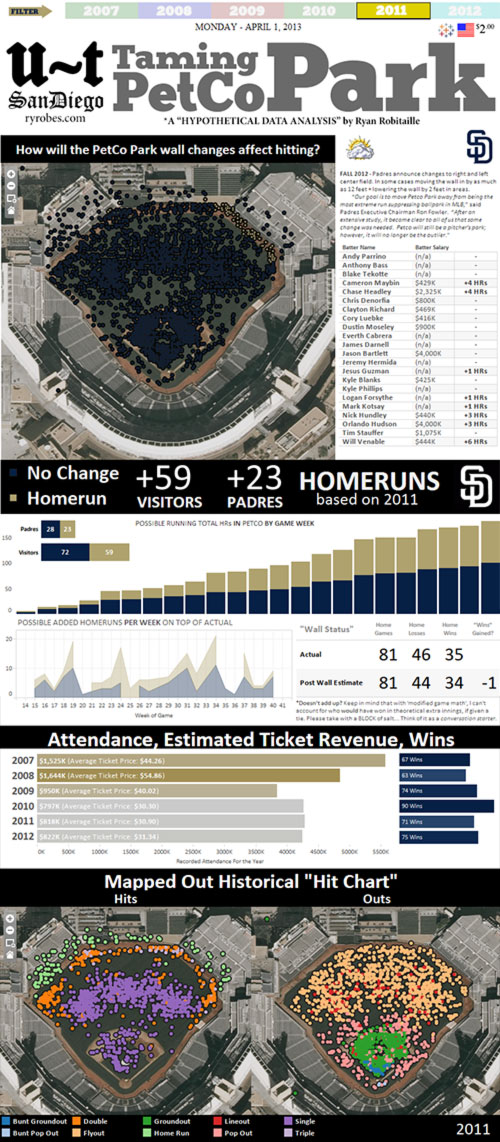
"Taming PetCo Park". Click for full interactive version.
Gird your loins. Next time, I'll have all the gory details - Python, SQL scripts and all....