Some Tableau Public Embed Code Hacking for more “Creative Blog Usage”

Not that a Tableau Public viz isn't already "jazzy" as it is - it's probably the single sexiest presentation layer I've ever encountered in my days of reporting (including some very expensive OLAP systems paired up with full blown dashboard products) and, trust me, I've worked with a lot of stuff.
I'll go over some Tableau Public basics on another day, in a screencast perhaps - but for now, I wanted to highlight a couple of things that I stumbled upon during my own customizations. Just a couple of little tweaks that I wasn't really able to find instructions for on the web. Hopefully, you'll find this useful for your next "viz", and make something so damn pretty it'll put all mine to shame.
1) Simple little Parlor Trick: Supplement a custom "loading screen" for Tableau's static cached report image
Tableau has its own tricks up its sleeve, it supplements a (slightly greyed out) cached image of your viz while all the requisite AJAX javascript libraries are loading in the background. In my mind, this is great because instead of looking at a useless box with just a "loading gif spinner" on it - at least the user gets a sense of what it is they are waiting for.
Now, this image isn't 100% accurate, in my experience, it is often rendered at a different size or slightly off center (possibly due to my odd hardcoded sizes in order to maximize how they look on the blog itself) - but that doesn't matter, it works incredibly well at keeping your user staring for those few precious seconds until everything is fully loaded and the interactive viz is working.
It gives them a shot of patience while they furrow their brows and try to decipher what the hell is happening in that magic box in front of them.
That being said, it works really well, but since I can't seem to leave well enough alone, I decided to monkey with it and see what happened.
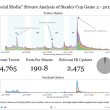
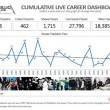
Here is my (mostly) unmolested embed code for one of my MetallicAnalysis dashboards (it's actual the 'small' dashboard on the main index page), I just added a bunch of carriage returns in order to make it more readable on my narrow ass blog theme.
<div class="tableauPlaceholder" style="width:854px; height:619px;">
<noscript><a href="#">
<img alt="Small Dashboard " src="http://public.tableausoftware.com/static/images/He/HeavyMetalDataMetallicas30YearsontheRoad/SmallDashboard/1_rss.png" style="border: none" />
</a></noscript>
<object class="tableauViz" width="854" height="619" style="display:none;">
<param name="host_url" value="http%3A%2F%2Fpublic.tableausoftware.com%2F" />
<param name="site_root" value="" />
<param name="name" value="HeavyMetalDataMetallicas30YearsontheRoad/SmallDashboard" />
<param name="tabs" value="no" /><param name="toolbar" value="yes" />
<param name="static_image" value="http://public.tableausoftware.com/static/images/He/HeavyMetalDataMetallicas30YearsontheRoad/SmallDashboard/1.png" />
<param name="animate_transition" value="yes" />
<param name="display_static_image" value="yes" />
<param name="display_spinner" value="yes" />
<param name="display_overlay" value="yes" />
<param name="display_count" value="yes" />
</object></div>
<div style="width:854px;height:22px;padding:0px 10px 0px 0px;color:black;font:normal 8pt verdana,helvetica,arial,sans-serif;">
<div style="float:right; padding-right:8px;">
<a href="http://www.tableausoftware.com/public?ref=http://public.tableausoftware.com/views/HeavyMetalDataMetallicas30YearsontheRoad/SmallDashboard" target="_blank">Powered by Tableau</a></div></div>
Your mileage may vary.
Now, a lot of these variables are pretty self-explanatory. Show Tabs, Animate Transition, Display Spinner, Overlay, (View) Count, etc. I'm sure that some of you have been altering these already.
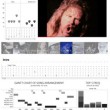
But you WILL see an option or "display_static_image" as well as a value for "static_image" above. Let's check out that auto-generated URL, shall we (resized to fit here, that is).

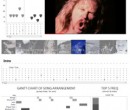
Like I said earlier, its a screenshot of the fully rendered report (albeit a bit tightly cropped). Its the first thing you see. So I decided to replace it with a goofy "Load" screen since I'm doing Metallica vizes. Load being the name of their 1997 album, which included the (often mentioned) picture of the peak of post-Black Album opulence that you see on the back cover.
Anyways, a few Photoshop minutes later, I have my little gag "Loading" screen.

Utterly hilarious AND incredibly clever? Well, I thought so. (Kidding) But it works, just make sure that the dimensions are the same as your viz is, at least width-wise, or else it might look a bit wonky. The rest will be filled with a light grey color.
Remember, this has to load while the user waits for everything ELSE to load - so making a big ass pre-loading-loading pic would probably hamper the user experience a bit. Just sayin'.
Check out how it works on a viz page here, or the screencast below.
Does this make sense for all vizes? Of course not, but depending on the subject matter and how "complete" and "artsy" you want to get - it's a cool little branding option for sure.
2) More Fun: Passing an arbitrary web parameter or variable from your site to a Tableau parameter for "dynamic" results
I do this stuff all the time in building custom reporting apps on the web (PHP, SQL Server, etc), it's barebones functionality to get any type of drill down and primitive level of report interactivity. But, I didn't even know this was possible with Tableau Public (at least as far as the documentation is concerned). I had assumed that the embedded vizzes were a "walled garden" affair - but a week or so ago I had an idea...
That particular day I had a lot of visitors from France & Poland (literally 70% of my, already spiked, traffic) due to some links on some European message boards. I thought to myself,
"Great! But I've got a bunch of US centric stuff on there, and they'd probably enjoy it more if they could immediately interact with their own country's shows instead of having to zoom and pan all around the damn earth to find them. Since I'm sure that's what they probably care about anyways"
I already knew that I could get WordPress Geo-Location Plug-in up and running that could estimate their country name via their ip address (using shortcodes even, wut wut!). The real trick was getting that to Tableau and getting it rendered on first page load (no pun intended).
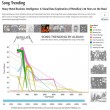
Let's look at my Tableau designer screen for the Shows in YOUR Country viz (the very one I was working on at the time).

For this usage, I created a parameter called "Visitor Country" and set the dashboard up so that changing the parameter value (a static list of countries pulled from the Country field in the data) would refresh the report. So now I had my dashboard with the static pre-populated drop-down of "data relevant" countries - and changing it triggered an action filter to refocus the map - ok, almost there, now for the hook.
Now, let's go back to our embed code, but this time we will focus on only 3 lines.
You'll see that those 3 values literally make up the source link for my particular report. Turns out that passing a parameter to that report is as easy as passing in URL $_GET vars in PHP. Depending on your platform you will be populating this differently (like my geo-location ip country).
Basically, just adding this string to the end of the url in the "name" param.
?Visitor Country=Denmark
Cake. Red Velvet multi-layered Data Cake.
Replace "Visitor Country" with the name of your Tableau parameter and Denmark with your value, obviously.
Scroll to the right to see the difference.
Just like the first tip - Simple, but it works. You can even pile up parameters by using the standard URL?param1=value1¶m2=value2¶m3=value3 pattern.
3) Now that you've mastered that, some deeper "integration" fun...
...We can start to do some more crazy things. The next, slightly harder usage was putting it all together in a seemless manner, at least to the user. I'm talking about building WordPress page(s) that pass a variable from the WordPress URL to Tableau, while still using pretty permalinks, not breaking WordPress, and all using only ONE Tableau report and ONE WordPress page. Take this link list for example.
Shows in Argentina, Australia, Austria, Belgium, Brazil, Bulgaria, Canada, Chile, Colombia, Costa Rica, Croatia, Czech Republic, Denmark, Estonia, Finland, France, Germany, Greece, Guatemala, Hungary, Iceland, India, Indonesia, Ireland, Israel, Italy, Japan, Latvia, Lithuania, Mexico, New Zealand, Norway, Panama, Peru, Philippines, Poland, Portugal, Puerto Rico, Romania, Russia, Serbia, Singapore, Slovakia, Slovenia, South Africa, South Korea, Spain, Sweden, Switzerland, Thailand, The Netherlands, Turkey, UK, USA, Venezuela, etc.
Each of those links references a good-looking and "normal" URL, for example:
http://ryrobes.com/metallicanalysis/metallica-shows-in-denmark
What am I doing in this example to keep everything working well together?
- Faking the WordPress permalink structure
(by redirecting it in pass-through mode to a separate but hidden page) - Passing that var to rebuild the page title & meta description
(WordPress theme header.php page.php hacking) - Updating several fields on the page itself
(embedded php in the WordPress page) - THEN passing that bad-boy to the Tableau embed code to bring it all home
(as shown above, except with embedded php)
Booya, dynamically populated viz via beautifully "hidden" URL parameters (not really hidden, but not ugly-ass obvious ones). They look like they are 50+ individual pages, not a thinly veiled dynamic URL query structure.
What's next? Doing the same thing, but having layers of detail. Building dynamic URLs within Tableau that link to another more detailed and parametized page and Tableau report - therefore creating a multi-layered Tableau "drill down" for the end user (for all intents and purposes).
I'm sure I skipped or missed something, let me know so I can add / fix it.