Song Trending
Heavy Metal Business Intelligence: A Visual Data Exploration of Metallica's 30 Years on the Road
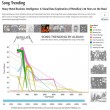
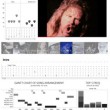
Song trending over time, sliced by album with calculated trend lines. Only songs that were actually played will show up. Click on the album cover to change the graph. It's interesting to note that after the initial promo tours ended, songs from Load and St. Anger practically dropped off the setlists.
Show and song data from Metallica.com, location and distances calculated by Google Maps API, song length data from MusicBrainz database, visualization software by Tableau Public, and putting it all together courtesy of Me.
More Metallica Reports, Setlists, Analytics and More
Adding new stuff all the time and will be refreshed after every 2012+ Metallica show and festival. Think of anything that should be here but isn't, see anything that is wrong? Leave a comment, mate!
