Archive | Data RSS feed for this section

1 April 2013 1 Comment

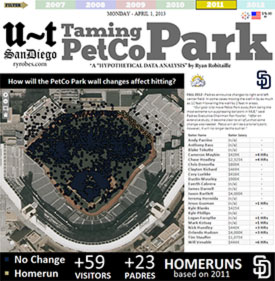
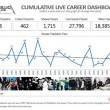
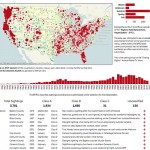
Going Yard: Using MLB data and Tableau 8 to “re-imagine” Homeruns in PetCo Park – “The Business Case”

Answering life’s Big Questions with Data Viz: The San Diego Padres are changing the wall dimensions for their home stadium, PetCo Park, for the 2013 MLB season. In a notoriously large “pitchers park”, how might this change affect the amount of Homeruns, the Padres record, and (possibly) ticket sales?

2 December 2012 21 Comments

Building Tableau Data Extract files with Python in Tableau 8 – Sample Usage

If you were learning (and / or partying) with us at the Tableau Customer Conference 2012 in Beautiful San Diego – then you’ve probably been playing around with the Tableau 8 Beta over the past few weeks. Tableau 8 bring a whole new slew of features – INCLUDING 2 new APIs… I’m going to go over some sample Python usage for the new ‘Tableau Data Extract’ API…

16 October 2012 6 Comments

Face Harvesting: Download your Facebook data for External Reporting and Visualization

I’m always on the lookout for cool new data feeds that I can mess with – as you can clearly see from some of the other posts on this site. Usually it involves some scripting, screen-scraping, system fiddling, and general madness – basically meaning that some people can get it to work, while others cannot. […]

17 July 2012 3 Comments

Cars, Computers and Software: Quick Tableau of data from my VW’s “On Board Diagnostic” (OBDII) port

Just a quick little one-off I did over the weekend while testing some stuff. I’ve been toying with a couple of USB>OBD2 adapters and some linux scripts for a few days in order to spec out and build a much-bigger car-based “data” project.

But in the meantime…

3 July 2012 3 Comments

Get Some! Query MLB Gameday Data with OData and Tableau Public

Baseball. If is ANY sport in America that is “all about the data”, it’s baseball. Although we touched on this topic last year, I never really gave it its full round of posts that it deserves.

Well, finally that day has come – except now its even better…

15 March 2012 4 Comments

Visualizing Bigfoot of the United States

A fun little Viz I did about Bigfoot sightings.

Basically, I harvested all the sighting info off of The Bigfoot Field Research Organization site with Python and the Scrapemark module – inserted it into a local SQL Server database – cleaned it up and threw up a pretty looking Viz using Tableau Public.

Visualizing Squatch of the Nation!

I’m pretty happy with it – its quite interactive and hopefully someone finds it fun or interesting.