Mapping San Diego Padres Hits & PetCo Park Changes | Tableau 8
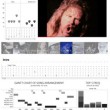
 Anyone who was at the Tableau Customer Conference in November 2012 has seen this beautiful ballpark. It's where we had the "Official Customer Party" at the end of the week. You might not have noticed, but there was active construction going on in right field. This got me thinking...
What *MIGHT* would have happened if they had made this change sooner?
Granted, it's not a very big change (approx 12 feet in + 2 feet lower in right) but baseball is a sport of unexpected events. The simplest change could alter the course of a game and (maybe) a season.
To get this data, I mined the MLB Gameday XML site for everything it had, and then geocoded the x/y "observational hitchart" values they record (if you've ever used the site, you know they have a 250x250 gif / pixel grid they display them on). Mapping pixels to Feet then Feet to Lat and Long. The margin of error is high, but I still think it tells an interesting story - and it's the most complete story I've seen of this kind of "event".
Designed in the visual style of the San Diego Union Tribune.
Also, more about the "Business Case" here and techy details of all this coming soon.
Also, more about the "Business Case" here and techy details of all this coming soon.
[full explanation post coming at a later date]
UPDATE: I realize that there are some issues with the "possible" Win/Loss section. Will address tomorrow.
The SQL queries / views for this thing are immense. :)
The SQL queries / views for this thing are immense. :)

