Finding Bigfoot (Data) – Visualize the Squatch
Look out! Bigfoot are EVERYWHERE! I didn't even realize! ;)
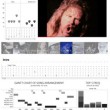
Another little Data Hacking / Automated Python Scraping / Tableau experiment. I "gathered" all the report / sighting data off of the BFRO site last night - imported it all into SQL Server 2012 (Express) - cleaned and scrubbed it up with a bunch of stored procedures in SQL (well, cleaned up as much as I could and keep my sanity), and booya - visualized beautifully by Tableau (yet again). Props to the BFRO peeps for having all this data available, I just wish it was presented a bit differently. (hint, hint)So, I present - the fanciest Bigfoot presentation ever. HEAVILY "clickable", too.
Data Updated 6/14/2012: Added almost 40 "new" Sightings. Newly submitted sightings will appear as green instead of red
Click on any year, location, season, or detail field and the detail info list will change.
Hover over the + sign on the right for even more squatchy sighting tooltip details.
Hover over the + sign on the right for even more squatchy sighting tooltip details.
Nowhere near as cool as my Metallica visualizations, but hey, I'm wicked biased on that one.
As I said above, the original source of the data can be found here - so all credit goes to them, I just mixed it all together in a sexy looking way.
Dig this? Check out some of my other "out of the box" data visualizations / dashboards
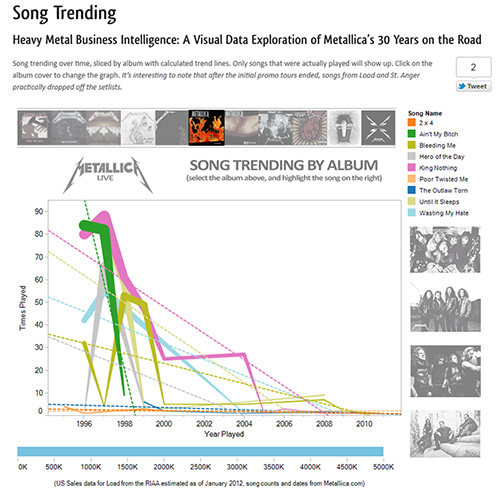
Metallica Tour Visualizations
Lots of them. Lots. Even if you aren't a fan - it makes an interesting BI Dashboard POC.
Metallica Member Timeline
Simple interactive timeline (in gantt chart form) of the different Metallica members and their time with the band.
WineLibrary / TV / GaryVee Reviews
Fun viz of WineLibrary.com's inventory mashed with WineLibraryTV's entire internet catalog.

