7 August 2012 1 Comment

Turning Guitar Tabs into structured Data. Silicon crunching Metal.

I’m always looking for data from unlikely sources, especially sources that are close to my own bizarre interests. Anyone who played guitar at one point or another has probably used tablature.
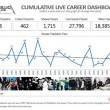
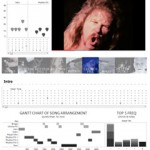
What if we scripted out a way to crunch through an old school tab text file, split it up in a logical way, and insert it all into a database for display / analysis…

13 March 2012 38 Comments

Harvesting Twitter Search Results for Analysis using Python & SQL Server

Twitter. It’s everywhere. It’s Data. Realtime, Social, Contextual Data. But, if you want to do any real trending, data mining, post-processing, or even simple analysis on it – you really need to be making a historical record of what you’re looking for and store it in a usable way. I will show you how to create SQL Server tables and use a simple Python script to pull out tweets and save them for future analysis.

8 March 2012 6 Comments

Some Tableau Public Embed Code Hacking for more “Creative Blog Usage”

As I’ve been very vocal about all over Twitter and elsewhere – I’ve been spending a lot of time playing with Tableau Public over the past few weeks. Lots of learning, experimentation, tweaking, and some full blown data / analysis presentations have occurred. During that time I learned a lot about the way the product works and continue to try and “jazz” up my Tableau “vizes” in any way I can. Here are a couple of trick that you might find as useful as I did.

25 February 2012 0 Comments

Rare Shit: Scoring Songs on a Setlist by Historical Context (Frequency, Rank, Ntile)

It’s interesting, the types of data conversations you have with people when discussing a unique project like MetallicAnalysis. You’re trying to show things in a different way and get as deep as possible, BUT never want to get too lame or “tech-y”, else it loses contact with the actual subject matter and begins to make less sense. Numbers are cool, but numbers that ACTUALLY FUCKING MEAN SOMETHING to the average fan / person are way cooler…

17 February 2012 2 Comments

Some Metallica Setlist Analysis using Tableau Public Visualization Software and some Python Hacking

I’ve been messing around with Tableau Public for a few nights, and I must say that it is damned impressive, and I’ve used a LOT of Reporting / Analysis / Business Intelligence tools in my day.

I needed to do a proper test / POC; the question was – what kind of data do I use to give it a proper test drive?

Anyone who knows me knows that I’m a huge Metallica fan, hell for as long as I can remember, that’s just been “one of my things” (as many current, ex-girlfriends, and ex-wives can attest to)…