2 December 2012 21 Comments

Building Tableau Data Extract files with Python in Tableau 8 – Sample Usage

If you were learning (and / or partying) with us at the Tableau Customer Conference 2012 in Beautiful San Diego – then you’ve probably been playing around with the Tableau 8 Beta over the past few weeks. Tableau 8 bring a whole new slew of features – INCLUDING 2 new APIs… I’m going to go over some sample Python usage for the new ‘Tableau Data Extract’ API…

16 October 2012 6 Comments

Face Harvesting: Download your Facebook data for External Reporting and Visualization

I’m always on the lookout for cool new data feeds that I can mess with – as you can clearly see from some of the other posts on this site. Usually it involves some scripting, screen-scraping, system fiddling, and general madness – basically meaning that some people can get it to work, while others cannot. […]

15 June 2012 1 Comment

Viz Updates – Metallica & Bigfoot refreshed! Plus, “The Data Box”…

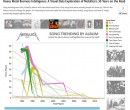
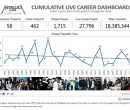
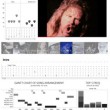
Did a data refresh on 2 of my most the most popular visualizations last night – Metallica has played about 15 shows since I last ran the data-gathering routines, and Bigfoot has been reported another 40+ times! Holy cats! I also have a cool announcement for all you data-junkies out there…

7 June 2012 15 Comments

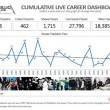
Building and Loading Sexy Operational Dashboards with DucksBoard.com

You never know what awesome stuff you’re going to find… While I was browsing the web yesterday evening, I landed upon a article explaining how ‘Starting Pages’ are out-of-fashion and now everyone wants a ‘Data Dashboard’. Which, intrigued me – since dashboards and operational analytics are a big part of what I do for a […]

15 March 2012 4 Comments

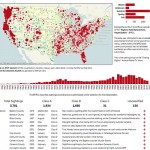
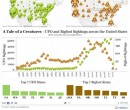
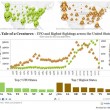
Visualizing Bigfoot of the United States

A fun little Viz I did about Bigfoot sightings.

Basically, I harvested all the sighting info off of The Bigfoot Field Research Organization site with Python and the Scrapemark module – inserted it into a local SQL Server database – cleaned it up and threw up a pretty looking Viz using Tableau Public.

Visualizing Squatch of the Nation!

I’m pretty happy with it – its quite interactive and hopefully someone finds it fun or interesting.