15 March 2012 4 Comments

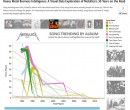
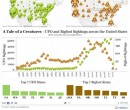
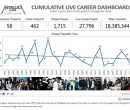
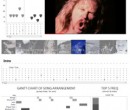
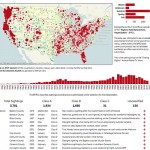
Visualizing Bigfoot of the United States

A fun little Viz I did about Bigfoot sightings.

Basically, I harvested all the sighting info off of The Bigfoot Field Research Organization site with Python and the Scrapemark module – inserted it into a local SQL Server database – cleaned it up and threw up a pretty looking Viz using Tableau Public.

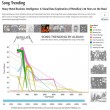
Visualizing Squatch of the Nation!

I’m pretty happy with it – its quite interactive and hopefully someone finds it fun or interesting.

13 March 2012 38 Comments

Harvesting Twitter Search Results for Analysis using Python & SQL Server

Twitter. It’s everywhere. It’s Data. Realtime, Social, Contextual Data. But, if you want to do any real trending, data mining, post-processing, or even simple analysis on it – you really need to be making a historical record of what you’re looking for and store it in a usable way. I will show you how to create SQL Server tables and use a simple Python script to pull out tweets and save them for future analysis.

25 February 2012 0 Comments

Rare Shit: Scoring Songs on a Setlist by Historical Context (Frequency, Rank, Ntile)

It’s interesting, the types of data conversations you have with people when discussing a unique project like MetallicAnalysis. You’re trying to show things in a different way and get as deep as possible, BUT never want to get too lame or “tech-y”, else it loses contact with the actual subject matter and begins to make less sense. Numbers are cool, but numbers that ACTUALLY FUCKING MEAN SOMETHING to the average fan / person are way cooler…

1 December 2009 1 Comment

Cut-N-Paste Corner: Microsoft SQL Server 2000, 2005, 2008 Simple Loop Template

I think that ‘data wrangling’ takes a special kind of problem solving mentality. Keeping data current, cleaning it, merging it, aggregating it, and creating summary (or data warehouse) tables for reporting purposes… For MANY years I used Express installations of SQL Server 2000 as my ultimate data Swiss Army knife. It was like a secret […]