Viz Updates – Metallica & Bigfoot refreshed! Plus, “The Data Box”…
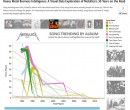
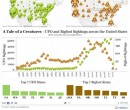
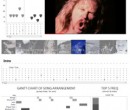
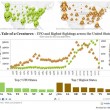
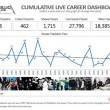
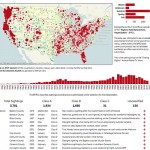
Did a data refresh on 2 of my most the most popular visualizations last night – Metallica has played about 15 shows since I last ran the data-gathering routines, and Bigfoot has been reported another 40+ times! Holy cats! I also have a cool announcement for all you data-junkies out there…

 Follow me on Twitter!
http://twitter.com/ryrobes
Follow me on Twitter!
http://twitter.com/ryrobes
 Facebook? Why Not!
http://facebook.com/ryrobes
Facebook? Why Not!
http://facebook.com/ryrobes