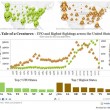
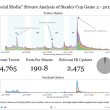
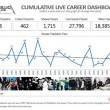
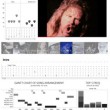
Some Metallica Setlist Analysis using Tableau Public Visualization Software and some Python Hacking
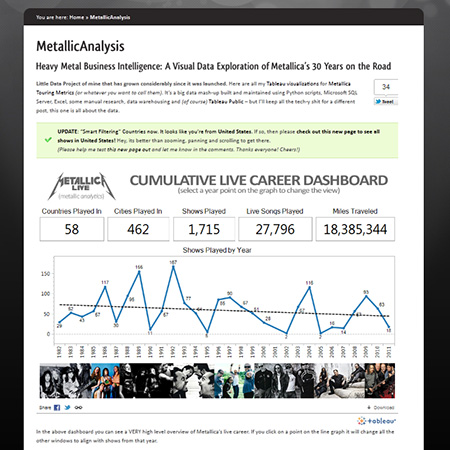
I've been fucking around with Tableau for a few nights, and I must say that even the free "Public" version is damned impressive, and I've used a LOT of reporting / business intelligence tools, hell, I pretty much make 80% of my living building solutions around that exact business need.
The question was - what kind of data do I use to give it a proper test drive...
Anyone who knows me knows that I'm a huge Metallica fan, hell for as long as I can remember, that's just been "one of my things" (as many current, ex-girlfriends, and ex-wives can attest to)
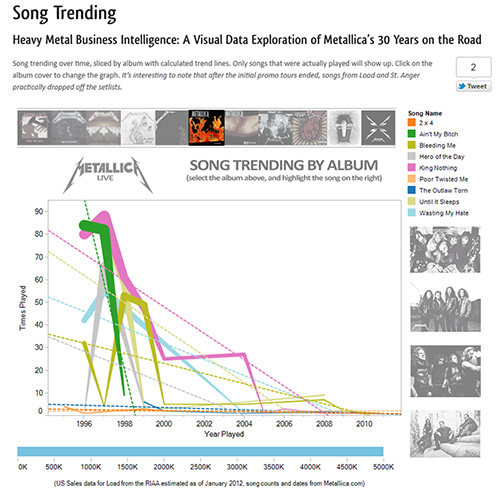
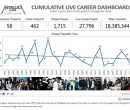
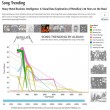
so, to make a ling story short, I ended up writing a python script to scrape all the setlist data off of the official site (with the easy-peazy scrapemark module and pymssql), clean it up a bit, another python script to geocode all the shitty venue / location data, inserted it into a local SQL Server database and viola.
Is it ground breaking? No.
Is Lars going to call me and praise my analysis? No.
Is anyone even going to give a shit at all? Probably not.
But, hey, it was a fun little exercise. Hell, I might even be adding song and show lengths to it in the future - I'd be amused with a metric that says that James Hetfield has spent 1.25 years of his life on stage singing Master of Puppets.
(UPDATE: It only turns out to be 8.3 days straight playing Puppets. Fuck)
I'll probably post the Python scraping scripts I used in the next few days. They might be of some help to someone - I know I get lots of hits from people using my use a Python script as a windows service post.
UPDATE: I'm too lazy to fix my theme to make this fully visible (aka, it looks like shit), so I'm going to post it on a seperate page here.
I've take out the embedding since this data has its own set of pages on this site now. See above "MetallicAnalysis".

