Building and Loading Sexy Operational Dashboards with DucksBoard.com
You never know what awesome stuff you're going to find...
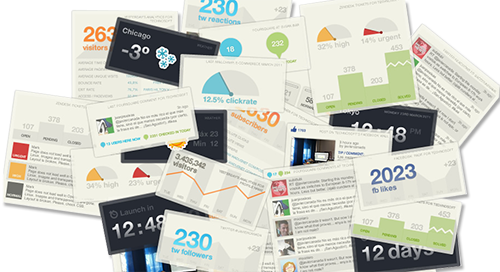
While I was browsing the web yesterday evening, I landed upon a article explaining how 'Starting Pages' are out-of-fashion and now everyone wants a 'Data Dashboard'. Which, intrigued me - since dashboards and operational analytics are a big part of what I do for a living (and for fun too, sad isn't it).
They had a small screenshot and a mention of a site called DucksBoard.com, which I had never heard of before, so, being a sucker for eye-candy, I decided to check it out. It's basically a really sleek workspace where you can "mash-up different widgets that represent different services and track your "life data" as well as "biz data". Call it social graph, call it online reputation, call it being late on 15 project deliverables - call it all three. They have a ton (100+) of out of the box metrics for different services and WAY more than just the usual (Facebook, Twitter, Foursquare, etc) - not to mention its has a really sweet looking, fast, modern interface.
(Cool little vid too)
But what got me REALLY interested was that they have a (very easy to use) 'Push API' where I can send my OWN data to their servers and include it on my dashboard in all its sexy calculated glory.
Not to mention that fact that a Developer account is free, you just don't get to use any of the pre-packaged service "widgets" (sorry, I hate that word, but couldn't find a proper replacement) besides "Custom Data" and Github (which is genius on their part). I'm sure I will get a full account soon enough, for my testing phase is BYOD, 'Bring Your Own Data' time!
The immediate 'problem' it solved for me?
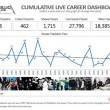
I have a pretty complex system of python-based data "harvesters" running non-stop on a dedicated system at home. They are constantly pulling from various social media tool APIs (and sports sites), inserting them into the database, as well as going back to the users and mining information about them. READ: A Shitload of moving parts, plus inserts and updates like crazy.
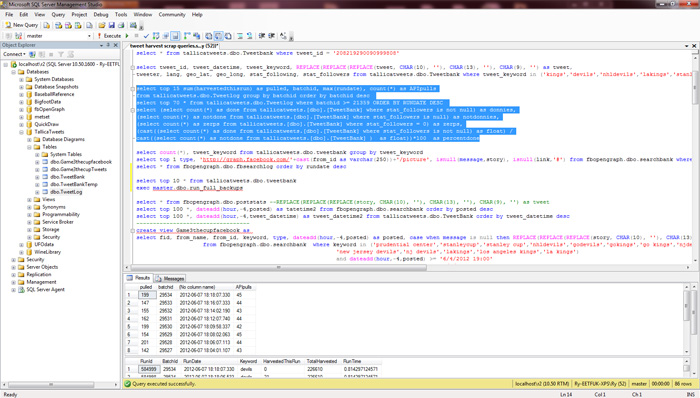
How do I manage and monitor all this insanity? The lazy way. I have a huge amount of SQL scraps where I can run a query and see what is happening via a bunch of transaction tables. How much is being pulled, how long its taking, what is trending, etc. It's a bit of a pain. I do a lot 'code chunk highlighting' and then hitting F5. But it works. I like to spend my time making the programs better and expanding on them, NOT by prettifying the back-end - only I see that.
This..
But... let's say I had these same queries (albeit simpler and quicker versions) being polled automatically and sent up to some sex-pot dashboard in the sky? Fuck. Then I could just sit back, crack open a beer, and watch the data roll in (so to speak) - plus, I wouldn't even have to be home to check-in on them. I could go to the BAR! (sensing a theme here?)
I was sold.
Few hours of Python later, it turns out to have been a good exercise - simple, elegant, user-friendly, and def expandable.
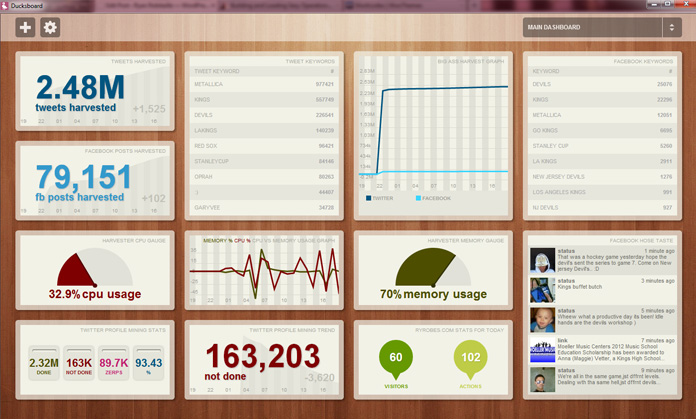
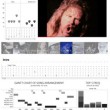
To this... Huzzah!
Basically, it works like this - you start out with a blank canvas dashboard / scorecard to work with and can add and arrange different metric graphs, gauges, and text objects. Once you configure each piece it will give you a unique and private url that you can use to post your data to (which shows up in like a second, Damn impressive).
Different objects have different data formats ranging from the super-simple (a single value, '145.2') to the moderate (a few nested dictionaries and lists), but fear not - the API is so easy a gecko could use it.
Here are a few examples:
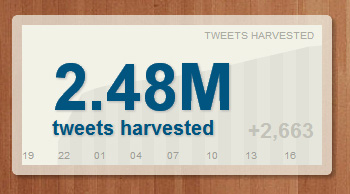
Here is a simple "counter box". You send it a value (however often you like, I do it about every 2 minutes) and it gets displayed and charted in style.
First we need to connect to our DB and get some imports out of the way.
from requests.auth import HTTPBasicAuth
api_key = 'availableinyourducksboardcontrolpanelandwidgetsettings'
# for printing out nicely formatted JSON for debugging
pp = pprint.PrettyPrinter(indent=3)
# connect to our db, and make a cursor
conn = pymssql.connect(host='localhost:1450', user='sa', password='bestpassever')
conn.autocommit(True)
cur = conn.cursor()
Notice I'm using the awesome 'Requests' module by @kennethreitz. Makes everything so much easier than urllib (but we do use urllib a bit). Ok, now that we've got a workable data connection, lets PUSH some data.
cur.execute("select count(*) from tweetarchive.dbo.tweetbank")
tweets = cur.fetchone()[0]
#push tweets to duck
payload = {"value": tweets}
r = requests.post('https://push.ducksboard.com/v/99913', auth=(api_key, 'x'), data=json.dumps(payload))
print r.text #just so we can see that beautiful {"response": "ok"} response
Done. Graphs are done the same way, just with a different end point.
Next up - dual line graph. More of the same. Granted, my graph isn't very exciting. Working on that later.
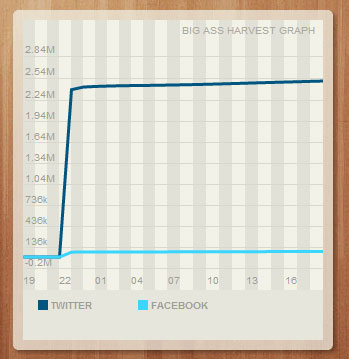
Again, we are still sending values to 2 diff endpoints. Exactly like the counter, its just handled differently on the Duck side.
payload = {"value": tweets}
r = requests.post('https://push.ducksboard.com/v/500989', auth=(api_key, 'x'), data=json.dumps(payload))
print r.text
# big ass facebook graph
payload = {"value": facebooks}
r = requests.post('https://push.ducksboard.com/v/589788', auth=(api_key, 'x'), data=json.dumps(payload))
print r.text
Little more complicated is the Leaderboard.
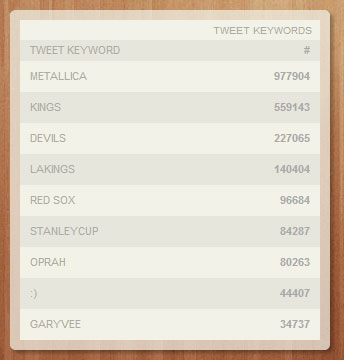
The correct format for sending THIS payload is this (regardless if you're sending 3 values or 1):
"value": {
"board": [
{"name": "Abdul-Jabbar", "values": [38387, 1560, 24.6]},
{"name": "Karl Malone", "values": [36928, 1476, 25.0]},
{"name": "Michael Jordan", "values": [32292, 1072, 30.1]},
{"name": "W. Chamberlain", "values": [31419, 1045, 30.1]},
{"name": "Kobe Bryant", "values": [29484, 1161, 25.4]},
{"name": "Shaq O Neal", "values": [28596, 1207, 23.7]},
{"name": "Moses Malone", "values": [27409, 1329, 20.6]},
{"name": "Elvis Hayes", "values": [28313, 1303, 21.0]},
{"name": "H. Olajuwon", "values": [26946, 1238, 21.8]}
]
}
}
Which we can do by manipulating an ordinary DB cursor resultset. There are much more efficient ways of constructing this payload, but this was the quickest way for me to write. Optimization can come later, if its needed at all.
tweet_keys = cur.fetchall()
leaderboard = dict()
leaderlist = []
for k,v in tweet_keys: #or k,v1,v2,v3,etc for multiples
leaderboard = dict()
leaderboard['name'] = str(k)
val_list = []
val_list.append(v)
#val_list.append(v2) #if needed
#val_list.append(v3) #if needed
leaderboard['values'] = val_list
leaderlist.append(leaderboard)
board = dict()
board['board'] = leaderlist
leader_value = dict()
leader_value['value'] = board
#tweet_keys (leaderboard of keywords)
r = requests.post('https://push.ducksboard.com/v/525568', auth=(api_key, 'x'), data=json.dumps(leader_value))
print r.text
Why not pull some data from another API and put it directly into Ducksboard? Sure. GetClicky.com, my all time favorite web-stats tracker... Call it.. API redirection. :)
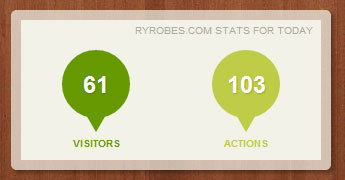
Epic hits for today.
f = urllib.urlopen('http://api.getclicky.com/api/stats/4?site_id=16786781&sitekey=45ydrhgsh5b32&type=visitors,actions&output=json')
s = f.read()
f.close()
getclicky = json.loads(s)
visitors = getclicky[0]['dates'][0]['items'] #get daily visitors so far
actions = getclicky[1]['dates'][0]['items'] #get daily actions so far
## visitors pin
r = requests.post('https://push.ducksboard.com/v/58701', auth=(api_key, 'x'), data=json.dumps(visitors))
print r.text
## actions pin
r = requests.post('https://push.ducksboard.com/v/58700', auth=(api_key, 'x'), data=json.dumps(actions))
print r.text
Criticisms?
None really.
I know the APIs just came out a month or so ago, but I'd def like to see some more chart / data widget options. There are a few "paid" ones that are tied to services that I would love to use for only the formatting and display. I was GOING to say that it'd be nice to have some more options and complexity on some of the widgets - however, complexity (while cool) often brings a boat load of annoying shit.
So I can appreciate the "FOCUS ON WHAT MATTERS" design sensibilities.
KISS: Keep It Simple, Sexy.
or is that
KISS: Keep It Sexy, Stupid.
Whatever. ;)

