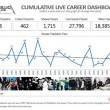
Rare Shit: Scoring Songs on a Setlist by Historical Context (Frequency, Rank, Ntile)
It's interesting, the types of data conversations you have with people when discussing a unique project like MetallicAnalysis. You're trying to show things in a different way and get as deep as possible, but never want to get too "tech-y" or else it loses contact with the actual subject matter and begins to make less sense. Numbers are cool, but numbers that ACTUALLY FUCKING MEAN SOMETHING to the average fan / person are way cooler. Like, Miles Davis level of cool.
When I work with clients on "regular" business intelligence projects, we end up talking about lots of things: reports, metrics, trends, percentages, key performance indicators, gauges, etc. But it always seems to boil down to a few simple questions:
"What actually matters?"
"What is the story your data is trying to tell you?"
and sometimes in the case of heavily operational systems,
"What can we do to ensure that this story always has a happy ending?"
People get so mired in the day to day banal minutiae of their business, they cease to SEE their business and the story it is telling them. Numbers in a vacuum don't tell too much of a story. Which brings us back to the "Live Metallica Data Story"...
If you're a big music fan like me, you've been to tons of shows; big ones, small ones, in dive bars, in stadiums, in people's basements, and everything in between. So you know what its like to follow a band (like, you know, actually follow, remember there was a world before Twitter and Facebook and 'follow' meant something different), know their body of work and be informed about the composition of the live show. Hell, maybe you're a hardcore fan and have even seen a few shows on different tours from different album release cycles (albums; another artifact for the times). You know, that whole thing called "Touring"?
Well, then you know (especially in that last case) that what gets played night to night ACTUALLY MATTERS.
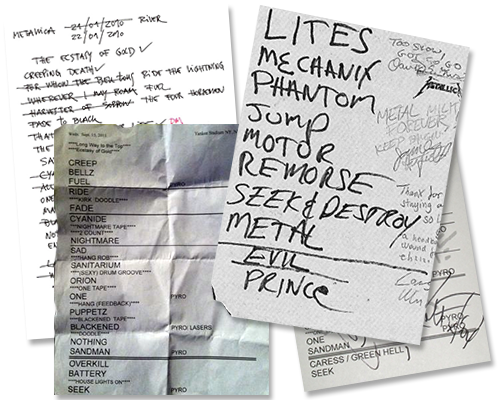
In the case of my little MetallicAnalysis play, I have data on the setlist level to go down to and show (at the most granular) - which is cool, but in a vacuum it loses something. Staring at a list of songs from days, weeks, or decades ago doesn't mean that much without context. It loses that little 'ohh, this is special' thrill that I got when they randomly played 'Outlaw Torn' in Albany, NY in '04 on the St Anger Tour. As a hardcore fan you KNOW that that shit does NOT HAPPEN on regular basis.
After thinking about it for awhile, I realized that as much 'heart' as is in that, there is some 'math' too.
I was in the middle of building out the "Last Show Played" report and was trying to figure out some calculations that would help show the "uninformed individual" what was so special about that particular setlist, in this case it was the final Metallica Club Fillmore Show. So, Enter Math. I started thinking about frequency, ranking, and percentiles. I thought, would that 'tell the story' somehow?
Came up with something like this.
SongName,
Frequency,
RowNum = Row_Number() OVER(Order By Frequency),
Rnk = RANK() OVER(ORDER BY Frequency),
DenseRnk = DENSE_RANK() OVER(ORDER BY Frequency),
NTile10 = NTILE(10) OVER(ORDER BY Frequency)
FROM (select SongName, count(*) as Frequency
from Metset.[dbo].[MetcomSetlists] group by SongName ) temp
Which gives me (showing only the Fillmore songs, not all 169 possible songs):
| SongName | Frequency | RowNum | Rnk | DenseRnk | NTile10 |
|---|---|---|---|---|---|
| Orion | 35 | 90 | 89 | 22 | 6 |
| Through the Never | 199 | 133 | 133 | 58 | 8 |
| Ride the Lightning | 282 | 142 | 142 | 66 | 9 |
| The God That Failed | 71 | 102 | 101 | 30 | 6 |
| Welcome Home (Sanitarium) | 843 | 159 | 159 | 82 | 10 |
| Rebel of Babylon | 1 | 2 | 1 | 1 | 1 |
| Blackened | 426 | 150 | 150 | 73 | 9 |
| Dirty Window | 31 | 86 | 86 | 20 | 6 |
| Frantic | 173 | 130 | 130 | 55 | 8 |
| Sabbra Cadabra | 6 | 66 | 66 | 6 | 4 |
| Iron Man | 2 | 41 | 37 | 2 | 3 |
| Paranoid | 2 | 38 | 37 | 2 | 3 |
| King Nothing | 335 | 147 | 147 | 71 | 9 |
| Whiplash | 856 | 160 | 160 | 83 | 10 |
| Motorbreath | 253 | 140 | 140 | 64 | 9 |
| Phantom Lord | 148 | 123 | 123 | 49 | 8 |
| Jump in the Fire | 87 | 107 | 107 | 34 | 7 |
| Metal Militia | 76 | 103 | 103 | 31 | 7 |
| Hit the Lights | 146 | 121 | 121 | 47 | 8 |
| Seek & Destroy | 1267 | 167 | 167 | 90 | 10 |
Makes sense, right? "Rebel of Babylon" had never been played before (shit, no one had even heard it before), so thus it is in the "1" (top) percentile (DenseRank in this case), and it also belongs in the 1 group for NTile (grouping of percentiles into a lower more general rank, in this case 1-10), so NTile 1 should equate to "Rarest Shit Ever" and NTile 10 is pretty much "Very Commonly Played", with 2-9 being all the layers in-between. Make sense? To me it does, that pretty much tells the story I was looking for.
So, I ran the calculation (or pre-calculation in this case - the Tableau visual layer can't do this, and honestly I wouldn't want it trying), put that data in the report and all was right with the world, right? Nope. What about the other 1,714 shows in the database? Oh, no problem, we can just use the numbers for all the songs I just ran and join them to the.... Oh. Shit. No we can't. The Fillmore numbers work because we're looking at the LAST THING that happened and calculating it using ALL THE DATA WE HAVE, which is pretty much our working set at this point.
The data is valid, but can I use that same probability to judge the impact of, let's say, a setlist from 1986? Fuck no. That was a 1,500 shows and 6 albums ago (not to mention 2 bass players - but that's another story). I needed to calculate the probability and frequency of all songs played only up to the date in question. So In essence, recalculating the entire universe of song possibilities for every single show including all previous shows.
Ended up using a cursor in a stored procedure to get a proper historical calculation for each show:
TRUNCATE TABLE Metset.[dbo].[SongCalcRarity]
DECLARE @showid INT
DECLARE show_by_show CURSOR FOR
SELECT showId FROM Metset.[dbo].[MetcomShows] ORDER BY showid ASC
OPEN show_by_show
FETCH NEXT FROM show_by_show
INTO @showid
WHILE @@FETCH_STATUS = 0
BEGIN
INSERT INTO Metset.[dbo].[SongCalcRarity] (ShowID, SongName, [Times], Percentile, [Rank], [Ntile], [Rarity])
SELECT @showid AS Showid, SongName AS [Song Name], Frequency AS [Times], DenseRnk AS Percentile, Rnk AS [Rank], NTile4,
CASE WHEN Ntile4 = 1 THEN 'Rarest. Shit. Ever'
WHEN Ntile4 = 2 THEN 'Super Fucking Hella Rare'
WHEN Ntile4 = 3 THEN 'Super Hella Rare'
WHEN Ntile4 = 4 THEN 'Hella Rare'
WHEN Ntile4 = 5 THEN 'Very Rare'
WHEN Ntile4 = 6 THEN 'Pretty Rare'
WHEN Ntile4 = 7 THEN 'Rare'
WHEN Ntile4 = 8 THEN 'Infrequent'
WHEN Ntile4 = 9 THEN 'Fairly Common'
WHEN Ntile4 = 10 THEN 'Not Rare At All' END AS [Tallica Rarity] FROM (
SELECT SongName,
Frequency,
RowNum = ROW_NUMBER() OVER(ORDER BY Frequency),
Rnk = RANK() OVER(ORDER BY Frequency),
DenseRnk = DENSE_RANK() OVER(ORDER BY Frequency),
NTile4 = NTILE(10) OVER(ORDER BY Frequency)
FROM (SELECT SongName, COUNT(*) AS Frequency FROM Metset.[dbo].[MetcomSetlists]
WHERE showid <= @showid
GROUP BY SongName ) tt ) ttt
--calculate ALL the stats, but then delete the historically irrelevelant ones (i.e. there is obviously zero probability of them playing a song they haven't written yet
DELETE FROM Metset.[dbo].[SongCalcRarity] WHERE showid = @showid AND songname NOT IN (SELECT songname FROM Metset.[dbo].[MetcomSetlists] WHERE showid = @showid)
FETCH NEXT FROM show_by_show
INTO @showid
END
CLOSE show_by_show
DEALLOCATE show_by_show
Hey, works for me. Check out the results on my visualizations over here.

 Follow me on Twitter!
http://twitter.com/ryrobes
Follow me on Twitter!
http://twitter.com/ryrobes
 Facebook? Why Not!
http://facebook.com/ryrobes
Facebook? Why Not!
http://facebook.com/ryrobes